|
|
|
|
|
|
||
|
|
Anthro-what? Anthro·pom·etry. This is the branch of ergonomics that deals with body shape and size. People come in all shapes and sizes so you need to take these physical characteristics into account whenever you design anything that someone will use, from something as simple as a pencil to something as complex as a car. |
|
|
|
Anthropometry Step-by-Step |
||||||||||||||||||||||||||||||||||||||||||||||||||||||||||||||||||||||||||||||||||
|
|
Decide who you are designing for Anthropometry tables give measurements of different body parts for men and women, and split into different nationalities, and age groups, from babies to the elderly. So first of all you need to know exactly who you are designing for. The group of people you are designing for is called the user population. If you were designing an office chair, you would need to consider dimensions for adults of working age and not those for children or the elderly. If you were designing a product for the home, such as a kettle, your user group would include everyone except young children (hopefully!). |
||||||||||||||||||||||||||||||||||||||||||||||||||||||||||||||||||||||||||||||||||
|
|
|||||||||||||||||||||||||||||||||||||||||||||||||||||||||||||||||||||||||||||||||||
|
|
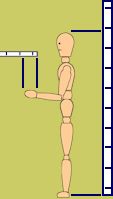
Decide which body measurements are relevant You need to know which parts of the body are relevant to your design. For example, if you were designing a mobile phone, you would need to consider the width and length of the hand, the size of the fingers, as well as grip diameter. You wouldn't be too interested in the height or weight of the user (although the weight of the phone might be important!) |
||||||||||||||||||||||||||||||||||||||||||||||||||||||||||||||||||||||||||||||||||
|
|
|||||||||||||||||||||||||||||||||||||||||||||||||||||||||||||||||||||||||||||||||||
|
|
Decide
whether you are designing for the 'average' or extremes Let's break the news - nobody is 'average' in all body dimensions. Someone might be say, of average height but have a longer than average hand length.
|
||||||||||||||||||||||||||||||||||||||||||||||||||||||||||||||||||||||||||||||||||
|
|
The variation in the size and shape of people also tells us that if you design to suit yourself, it will only be suitable for people who are the same size and shape as you, and you might 'design out' everyone else! Percentiles Percentiles are shown in anthropometry tables and they tell you whether the measurement given in the tables relates to the 'average' person, or someone who is above or below average in a certain dimension. If
you look at the heights of a group of adults, you'll probably notice
that most of them look about the same height. A few may be noticeably
taller and a few may be noticeably shorter. This 'same height' will be
near the average (called the 'mean' in statistics) and is shown in
anthropometry tables as the fiftieth percentile, often written as
'50th %ile'. This means that it is the most likely height in a
group of people. If we plotted a graph of the heights (or most other
dimensions) of our group of people, it would look similar to this:
First, notice that the graph is symmetrical – so that 50% of people are of average height or taller, and 50% are of average height or smaller. The graph tails off to either end, because fewer people are extremely tall or very short. To the left of the average, there is a point known as the 5th percentile, because 5% of the people (or 1 person in 20) is shorter than this particular height. The same distance to the right is a point known as the 95th percentile, where only 1 person in 20 is taller than this height. So, we also need to know whether we are designing for all potential users or just the ones of above or below average dimensions. Now, this depends on exactly what it is that we are designing. For example, if we were designing a doorway using the height, shoulder width, hip width etc., of an average person, then half the people using the doorway would be taller than the average, and half would be wider. Since the tallest people are not necessarily the widest, more than half the users would have to bend down or turn sideways to get through the doorway. Therefore, in this case we would need to design using dimensions of the widest and tallest people to ensure that everyone could walk through normally. Deciding whether to use the 5th, 50th or 95th percentile value depends on what you are designing and who you are designing it for. Usually, you will find that if you pick the right percentile, 95% of people will be able to use your design. For instance, if you were choosing a door height, you would choose the dimension of people's height (often called 'stature' in anthropometry tables) and pick the 95th percentile value – in other words, you would design for the taller people. You wouldn't need to worry about the average height people, or the 5th percentile ones – they would be able to fit through the door anyway. At the other end of the scale, if you were designing an aeroplane cockpit, and needed to make sure everyone could reach a particular control, you would choose 5th percentile arm length – because the people with the short arms are the ones who are most challenging to design for. If they could reach the control, everyone else (with longer arms) would be able to. Here are some examples of other situations - your design project will normally fit into one of these groups:
Sometimes you can't accommodate all your users because there are conflicting solutions to your design. In this case, you will have to make a judgment about what is the most important feature. You must never compromise safety though, and if there is a real risk of injury, you may have to use more extreme percentiles (1%ile or 99%ile or more) to make sure that everyone is protected (not just 95% of people). Can you see that in the last section of the table above, 1%ile and 99%ile would be safer? |
 |
|||||||||||||||||||||||||||||||||||||||||||||||||||||||||||||||||||||||||||||||||
|
|
|||||||||||||||||||||||||||||||||||||||||||||||||||||||||||||||||||||||||||||||||||
|
|
Think
about other human factors You may need to add corrections for clothing. Have you allowed for shoe heights? You generally add 20mm for fairly flat shoes, and more if you think users will be wearing high heels. If your product is to be used somewhere cold, can it still be used if someone is wearing gloves or other bulky clothing? We mentioned strength in the table above (did you notice?). It is important to take the strength of your users into account, as well as the environmental conditions and the space they have to perform tasks. If you were designing tools for changing car wheels, for example, it's more than likely that they would have to be used in cold and wet weather. People need to grip harder if their hands are wet and cold, and they need to exert more force to carry out tasks than they would if they were warm and dry. You may also need to consider people's eyesight and hearing abilities. Can they read the small labels on the remote control that you've designed? Is there enough light to read them by? Can they hear an alarm bell above the general noise in the room? |
||||||||||||||||||||||||||||||||||||||||||||||||||||||||||||||||||||||||||||||||||
|
Anthropometry tables There are many sources of information about anthropometry that provide tables or help you to find dimensions that you are looking for. Among these are: |
|||||||||||||||||||||||||||||||||||||||||||||||||||||||||||||||||||||||||||||||||||
 |
Bodyspace:
Anthropometry, Ergonomics And
The Design Of Work 2nd Edition Author: Stephen Pheasant ISBN: 0748403264 Publication Date: 1998 Type: Paperback, 260pp Publisher: Taylor & Francis Price: Ł29.99 You may also find Anthropometrics, an introduction, by Stephen Pheasant, a useful book (1990, BSI, ISBN 0580 182347). It is out of print but your library may be able to obtain a copy for you. |
||||||||||||||||||||||||||||||||||||||||||||||||||||||||||||||||||||||||||||||||||
 |
There is also a
software program that will help you find the measurements you
need. It's called PeopleSize and is available from Open
Ergonomics Ltd.
|
||||||||||||||||||||||||||||||||||||||||||||||||||||||||||||||||||||||||||||||||||
|
There are also lots of anthropometry tables
reproduced for you at a website called Anthropometry - an introduction for schools. |
|||||||||||||||||||||||||||||||||||||||||||||||||||||||||||||||||||||||||||||||||||
|
|||||||||||||||||||||||||||||||||||||||||||||||||||||||||||||||||||||||||||||||||||
|
| |
| Acknowledgments Content: Tina Worthy Images: IMSI's MasterClips Collection |


 Try
it for yourself! Measure your own height when you are standing up straight (without
shoes!), and measure the length of your hand from your wrist to the tip
of your middle finger.
Try
it for yourself! Measure your own height when you are standing up straight (without
shoes!), and measure the length of your hand from your wrist to the tip
of your middle finger.